Metabolic Test Learnings

The output from my metabolic test last week was a spreadsheet of raw data from the metabolic cart, which is food for further analysis. What do the numbers mean, how can I use them to inform my training etc. etc. Here’s a first pass at what I’ve managed to figure out so far.

Ventilatory Thresholds

There are two ventilatory thresholds, VT1 and VT2, which signify fundamental shifts in what’s happening your body as you exercise. VT1 is the point at which lactate levels in the blood begin to increase beyond resting levels and is usually marked by an increase in your breathing rate. Above VT1 lactate levels will increase as your effort increases, but will stabilise if you settle on a consistent effort. Your body can recycle lactate as fast as you produce it. VT2 is the point at which your body cannot recycle lactate fast enough and even if you are doing a consistent effort above VT2 lactate will keep increasing until you can’t exercise any more.

Ventilatory Threshold Graph

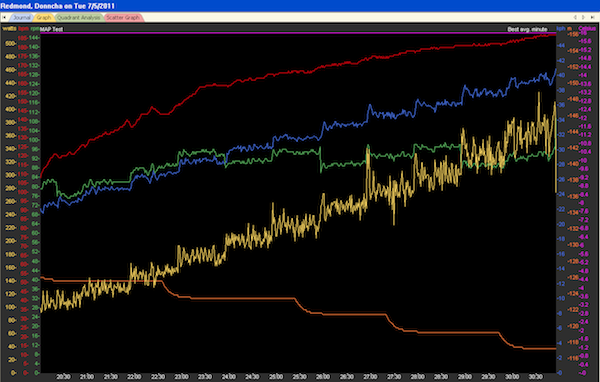
There doesn’t seem to be a simple formula you apply. Rather you graph breaths per minute and eyeball the points at which the slope of the graph appears to change, so it’s inherently subjective. In the above graph, VT1 appears to be around 138bpm for me, and VT2 is around 172bpm. VT1 seems about right based on experience, though VT2 feels a little too high.

What’s the relevance of VT1 and VT2 for training? Well in a Polarized Training model, which I’ll discuss in the future, the aim would be to do the vast majority of your training below VT1, with a small amount above VT2.

Fat Usage

My current weight is just under 92kg and I know from previous DEXA scans that my lean body mass, i.e: my weight if I were 0% body fat, is about 72kg. That’s a lot of lard to be carrying around, so what’s the ideal way to get rid of it? Well there’s only one way to get rid of it and that’s to get the fat released from your fat cells and burn it off.

Fuel Substrate Use Graph

Looking at my fuel substrate usage graph, taken from my earlier post, I can see that I burn approx. 0.75g of fat per minute consistently, from 100W all the way through to about 225W, or, in HR terms (going back to the spreadsheet), right up to about 155bpm.

You often hear that there’s no such thing as a fat burning zone and that you should just focus on working as hard as possible to burn more calories. However, as you can see from the graph above, that’s bollocks. There’s definite point at which I start burning less and less fat. It turns out too that my graph is indicative of pretty decent fat burning ability. Many people will never burn .75g/min at any level and may see significant drop off of their fat burning well before they get to 150bpm. Make a person like that train at high intensity and they’ll burn mainly carbs and the fat sitting around their gut won’t be burnt at all.

Even with a decent fat burning ability, at 170bpm I’m burning a total of about 1150kcal per hour, but I’d struggle to last a full hour at that rate, so I’d burn a max. of 46g of fat. However, at, say, 125bpm, while I’m only burning 690kcal/hr I burn a bit more fat at the lower intensity so I get rid of 53g of fat per hour. Significantly, at that effort I can ride for 5hrs or more if I felt like it, so in theory could burn off 250g+ of flab. Even if I only wanted to ride for one hour, I’d still burn 53g of fat at the easy pace versus 46g if I flogged myself.

Back to my weight. Weighing in at a hypothetical 82kg would leave me at a pretty athletic 12% body fat, so let’s do the maths. That’s 10kg of fat to shed, at a rate of 53g per hour, for a total of 188hrs of bike riding! At a max. of about 10hrs/week that’s four months of consistent riding. On the one hand it seems like a long time on the bike, but on the other, four months of work to reverse years of weight gain doesn’t seem too bad.

Metabolic Test

I went and had a Metabolic Test yesterday. A what, you ask? A metabolic test - you get on a stationary bike, they hook you up to a metabolic cart which measures the volumes of oxygen and carbon dioxide you inhale and exhale. You start cycling at a very easy rate, and every few minutes the rate increases until you’re too exhausted to cycle anymore. The data from the metabolic cart allows you to determine how much of your energy expenditure is coming from fat (FAT) and how much is coming from carbs (CHO) and how that changes as your effort increases.

Why Do This?

Well, it all started last year when I had finished a pretty consistent year of training and I looked back at my cumulative training data. I’d ridden a touch over 11,000km and burned about 270,000kcal but I hadn’t lost any weight. Sure, I have a sweet tooth and eat too much jellies etc. but overall my diet is pretty decent - bugger all processed food, cook most meals etc. etc. so I thought I’d have dropped a few kilos at least.

I’d read a little about metabolic tests over the years and decided I’d like to try one out, but the only place I could find that was offering them to the public was Jupiter Health on the Gold Coast, which isn’t convenient from Sydney. However, since we were moving to Brisbane in May 2018, I booked an appointment for late May last year. I did the test and it showed I was a really bad sugar burner, i.e: I was getting most of my energy from CHO on the bike and hardly burning any fat. This seemed to explain why I wasn’t losing weight - after all, if you’re not burning off your fat stores while exercising, when are you going to burn them off?

I haven’t done much training over the year since, but I have been reading about how to improve your fat burning. Alan Couzen, an exercise physiologist and coach has some informative articles, particularly How to turn yourself into a Fat-Burner, and while reading that I came across his articles on how you go about getting your fat burning tested, i.e: how to do a proper metabolic test, particularly Getting your ‘fat burning’ tested Part 1: Equipment and protocol.

Reading that confirmed some suspicions I had about the test I’d had done on the Gold Coast and the data I’d obtained from it. The two major concerns I had was that the basal rate data, obtained when you’re lying on a bed doing nothing for 15mins, showed me with a heart rate around 90-100bpm, which is about twice what I’d expect in that scenario. There was also a bit more fluctuation in the power data at each level and the time at each level didn’t seem to be consistent. I followed Alan’s suggestion to check with my local University’s Exercise Physiology department to see if I could do a test with them.

Luckily for me, I have Uni of Queensland (UQ) and Queensland Uni of Technology (QUT) to choose from, and, as it happened, QUT have their E3 Lab a 20min drive away, so I emailed them with my requirements and they were able to help.

The Protocol

Alan’s site provides a calculator where you can enter your estimated FTP and it pumps out your suggested starting level and how much the power output should be increased per level. It recommended that I start at 130W, but since the data from the previous test showed I was already starting to burn significant amounts of carbs at that level, I chose to start at 100W instead.

  • Each level lasts 5mins.
  • Start at 100W, then add 25W per level.

The guys doing the testing told me to tell them when I knew I would not be able to complete the next 5min level and we’d stop the test.

The Test

The test itself isn’t too exciting. As described, you start pedalling at an easy pace and it just keeps getting harder. The first 20 minutes are a bit boring as the work load is quite low and I was just trying to maintain a smooth pedal stroke and consistent breathing, i.e: instead of shallow breathing at low workloads, to try consistent deeper breaths throughout the test.

Wearing the mask take a bit of getting used to - at the start of the test you feel a bit weird as you’re not really breathing very often so it feels like the mask is keeping your mouth shut. Your heart rate is probably a few beats higher as a result too. As you start working harder and breathing more it becomes a non-issue.

The tightness of the straps keeping the mask on my face meant it was tricky to find a comfortable head position. Maintaining a normal riding position as if I was out on the road meant they were digging into the back of my head, so looking down at the bottom bracket seems to work best. I was getting a bit of a headache towards the end of the test too, most likely due to the straps’ tightness. However, tight straps equals tight mask seal equals accurate data!

Results

Here’s the basic fuel substrate use graph, with power output on the X-axis and kcal/min on the Y-axis.

Fuel Substrate Use Graph

So, when I’m exercising at 100W (v. easy) I’m getting a bit over 7kcal/min from FAT and almost nothing from CHO, and by the time I fell apart at 275W I was getting a bit under 6kcal/min from FAT but 15kcal/min from CHO.

Peak volume of oxygen consumed (not shown on graph) was 4.85L, giving me a VO2Max of 52.8ml/kg at 92kg, which just scrapes into the 95th percentile for my age, so happy enough with that. I can bump it a few points more by dropping a few kilos, plus the test protocol I used wasn’t ideal for finding a true max, so there may be room for improvement there too.

It turns out that I’m actually a good fat burner, which is the complete opposite of the earlier test. The most likely explanation for this about-face is that there was not a good seal around my nose and mouth when doing the first test, so the machine wasn’t only measuring the air I was inhaling and exhaling. That could skew the results significantly. It’s also the case that the equipment available in the Uni lab was much more professional than that in use the first time around, so accuracy was a lot better.

Normally these tests run until you start going anaerobic, at which point you are burning zero fat. However, I never got to that point, still burning a decent amount of fat at the last stage of 275W. I’ll need to read up on that, but I suspect it’s just an endurance issue - I’m just not fit enough to get to pure CHO burning given the 5min/level protocol. I’d definitely get there with shorter levels, and would probably have gotten there if I’d started at Alan’s suggested 130W.

Moral of the story: instead of going to the local physio/fitness place, take the advice in Alan’s article and see if your local Uni will run an experiment on you.

The downside is that I now have no excuse for being over 85kg, so I’ll just have to knuckle down to consistent riding and improve my diet quality as well. No shortcuts 🤣

MAP Test

Seeing as how I’m going track racing I figured I might as well find out how unfit I am. I’ve been doing little for the past few months and only started cycling infrequently about a month ago. My riding has basically consisted of a 70km cruise with Marc every second Saturday with little else.

I resolved to cycle a bit more regularly last week, so got a ride in on Friday, Saturday and Sunday, then figured I should do a MAP test to see exactly where my fitness was. I’d done one previously, about 18 months ago, when I first started training for La Marmotte and the procedure is the same; after a thorough warm-up, start cycling at an effort of 100W and increase by 25W/minute until you collapse in a heap. The best average power achieved for a minute is your Maximum Aerobic Power (MAP) and your Functional Threshold Power (FTP) is approximately 75% of your MAP. Your FTP is the power you can sustain for a one-hour, all-out effort and is used as the basis for setting training levels.

Anyway, to the test:


The results…

The above is the graph of the actual test, with the yellow line being power output. I finished up with a MAP of 367W, leading to an FTP of 275W, and a power to weight ratio at FTP of 3.05W. The test 18 months ago resulted in MAP 406W & FTP 305W, so I’m a little over 105 less fit than I was then. There’s work to be done!