Seeing as how I’m going track racing I figured I might as well find out how unfit I am. I’ve been doing little for the past few months and only started cycling infrequently about a month ago. My riding has basically consisted of a 70km cruise with Marc every second Saturday with little else.
I resolved to cycle a bit more regularly last week, so got a ride in on Friday, Saturday and Sunday, then figured I should do a MAP test to see exactly where my fitness was. I’d done one previously, about 18 months ago, when I first started training for La Marmotte and the procedure is the same; after a thorough warm-up, start cycling at an effort of 100W and increase by 25W/minute until you collapse in a heap. The best average power achieved for a minute is your Maximum Aerobic Power (MAP) and your Functional Threshold Power (FTP) is approximately 75% of your MAP. Your FTP is the power you can sustain for a one-hour, all-out effort and is used as the basis for setting training levels.
Anyway, to the test:
The results…
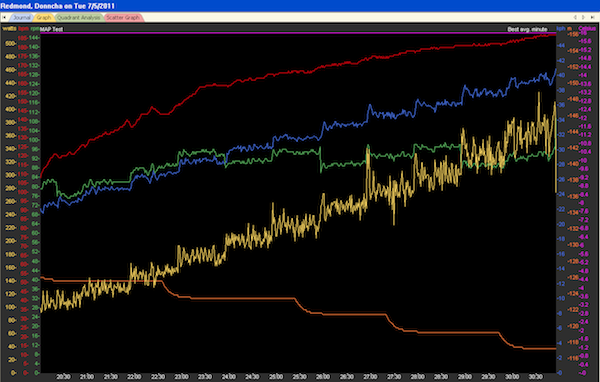
The above is the graph of the actual test, with the yellow line being power output. I finished up with a MAP of 367W, leading to an FTP of 275W, and a power to weight ratio at FTP of 3.05W. The test 18 months ago resulted in MAP 406W & FTP 305W, so I’m a little over 105 less fit than I was then. There’s work to be done!