The output from my metabolic test last week was a spreadsheet of raw data from the metabolic cart, which is food for further analysis. What do the numbers mean, how can I use them to inform my training etc. etc. Here’s a first pass at what I’ve managed to figure out so far.
Ventilatory Thresholds
There are two ventilatory thresholds, VT1 and VT2, which signify fundamental shifts in what’s happening your body as you exercise. VT1 is the point at which lactate levels in the blood begin to increase beyond resting levels and is usually marked by an increase in your breathing rate. Above VT1 lactate levels will increase as your effort increases, but will stabilise if you settle on a consistent effort. Your body can recycle lactate as fast as you produce it. VT2 is the point at which your body cannot recycle lactate fast enough and even if you are doing a consistent effort above VT2 lactate will keep increasing until you can’t exercise any more.

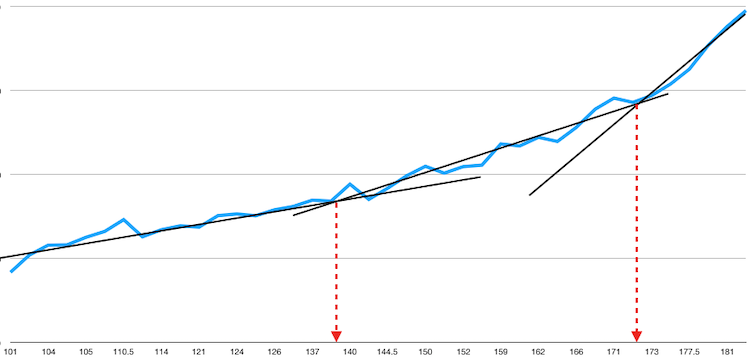
There doesn’t seem to be a simple formula you apply. Rather you graph breaths per minute and eyeball the points at which the slope of the graph appears to change, so it’s inherently subjective. In the above graph, VT1 appears to be around 138bpm for me, and VT2 is around 172bpm. VT1 seems about right based on experience, though VT2 feels a little too high.
What’s the relevance of VT1 and VT2 for training? Well in a Polarized Training model, which I’ll discuss in the future, the aim would be to do the vast majority of your training below VT1, with a small amount above VT2.
Fat Usage
My current weight is just under 92kg and I know from previous DEXA scans that my lean body mass, i.e: my weight if I were 0% body fat, is about 72kg. That’s a lot of lard to be carrying around, so what’s the ideal way to get rid of it? Well there’s only one way to get rid of it and that’s to get the fat released from your fat cells and burn it off.

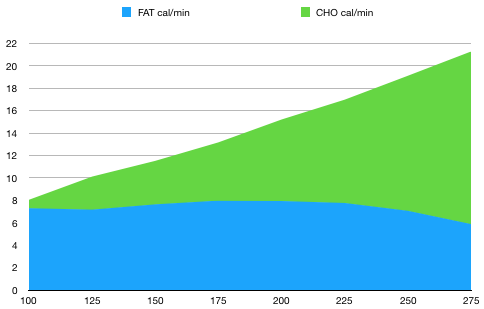
Looking at my fuel substrate usage graph, taken from my earlier post, I can see that I burn approx. 0.75g of fat per minute consistently, from 100W all the way through to about 225W, or, in HR terms (going back to the spreadsheet), right up to about 155bpm.
You often hear that there’s no such thing as a fat burning zone and that you should just focus on working as hard as possible to burn more calories. However, as you can see from the graph above, that’s bollocks. There’s definite point at which I start burning less and less fat. It turns out too that my graph is indicative of pretty decent fat burning ability. Many people will never burn .75g/min at any level and may see significant drop off of their fat burning well before they get to 150bpm. Make a person like that train at high intensity and they’ll burn mainly carbs and the fat sitting around their gut won’t be burnt at all.
Even with a decent fat burning ability, at 170bpm I’m burning a total of about 1150kcal per hour, but I’d struggle to last a full hour at that rate, so I’d burn a max. of 46g of fat. However, at, say, 125bpm, while I’m only burning 690kcal/hr I burn a bit more fat at the lower intensity so I get rid of 53g of fat per hour. Significantly, at that effort I can ride for 5hrs or more if I felt like it, so in theory could burn off 250g+ of flab. Even if I only wanted to ride for one hour, I’d still burn 53g of fat at the easy pace versus 46g if I flogged myself.
Back to my weight. Weighing in at a hypothetical 82kg would leave me at a pretty athletic 12% body fat, so let’s do the maths. That’s 10kg of fat to shed, at a rate of 53g per hour, for a total of 188hrs of bike riding! At a max. of about 10hrs/week that’s four months of consistent riding. On the one hand it seems like a long time on the bike, but on the other, four months of work to reverse years of weight gain doesn’t seem too bad.